Master the ICT Silver Bullet trading strategy with precise time windows, Fair Value Gap (FVG) entry models, liquidity sweep rules, and realistic risk management guidelines.
Advanced Forex trading goes beyond basic indicators and simple chart patterns by focusing on market structure, liquidity, institutional order flow, multi-timeframe analysis, macroeconomic factors, and professional risk management. Successful traders approach the Forex market through probabilities rather than predictions, identifying high-quality opportunities while carefully controlling exposure. By combining technical analysis, fundamental context, disciplined execution, backtesting, and trading psychology, traders can develop a structured and data-driven approach designed for changing market conditions.
Forex markets are experiencing increased volatility as traders focus on US dollar strength, interest-rate expectations, inflation, and central-bank decisions. The euro and British pound remain under pressure, while the Japanese yen is sensitive to expectations of further Bank of Japan rate increases. Upcoming employment data, inflation reports, bond yields, and central-bank statements could drive the next major currency movements
Structure-based trading is a price-action strategy that focuses on understanding market movements through higher highs, higher lows, lower highs, and lower lows. Traders use concepts such as Break of Structure (BOS), Change of Character (CHoCH), support and resistance, and liquidity to identify potential trends and reversals. By combining market structure with multiple timeframes and proper risk management, traders can find more systematic entry, stop-loss, and target levels instead of relying solely on indicators.
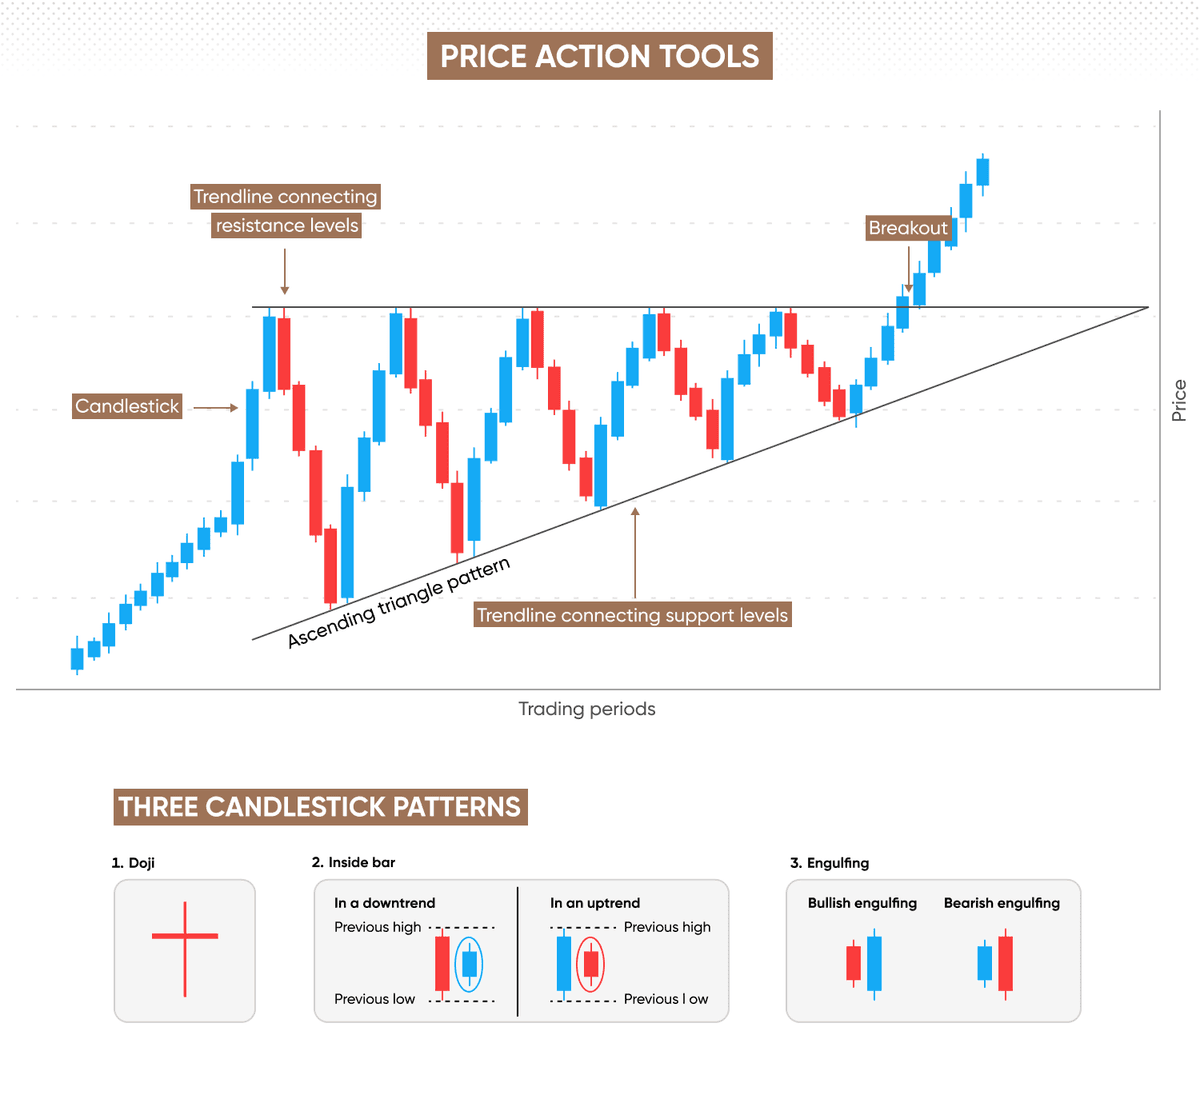
Chart patterns are important tools in technical analysis that help traders understand market structure and identify potential continuation or reversal setups. This article explains popular patterns such as double tops, double bottoms, head and shoulders, triangles, flags, pennants, and rectangles. It also covers confirmation, support and resistance, volume, risk management, and common mistakes. Understanding chart patterns can help traders make more structured decisions while recognizing that no pattern guarantees a particular market outcome.
ICT (Inner Circle Trader) is a price-action trading approach focused on understanding liquidity, market structure, fair value gaps, order blocks, displacement, and trading sessions. Traders use these concepts to analyze potential market movements and identify structured trade setups. Successful ICT trading also requires disciplined risk management, backtesting, and consistent execution, as no trading setup guarantees profits.
Price action trading focuses on analyzing market price movements without relying heavily on technical indicators. Traders study candlestick patterns, market structure, support and resistance, breakouts, and trends to identify potential trading opportunities. Proper risk management and disciplined execution are essential because no price action setup guarantees profits.
Candlestick charts help traders understand price movements by showing the open, high, low, and close of an asset. This article explains popular candlestick patterns such as Doji, Hammer, Shooting Star, Engulfing, Morning Star, and Evening Star, along with how traders use them with market context and risk management to analyze potential trading opportunities.

 Trading